

Doppler-exclusive
diagnostic, monitoring & predictive frameworks
for hemodynamics

Unprecedented quantification of many hemodynamic metrics
and doing it
NON-INVASIVELY
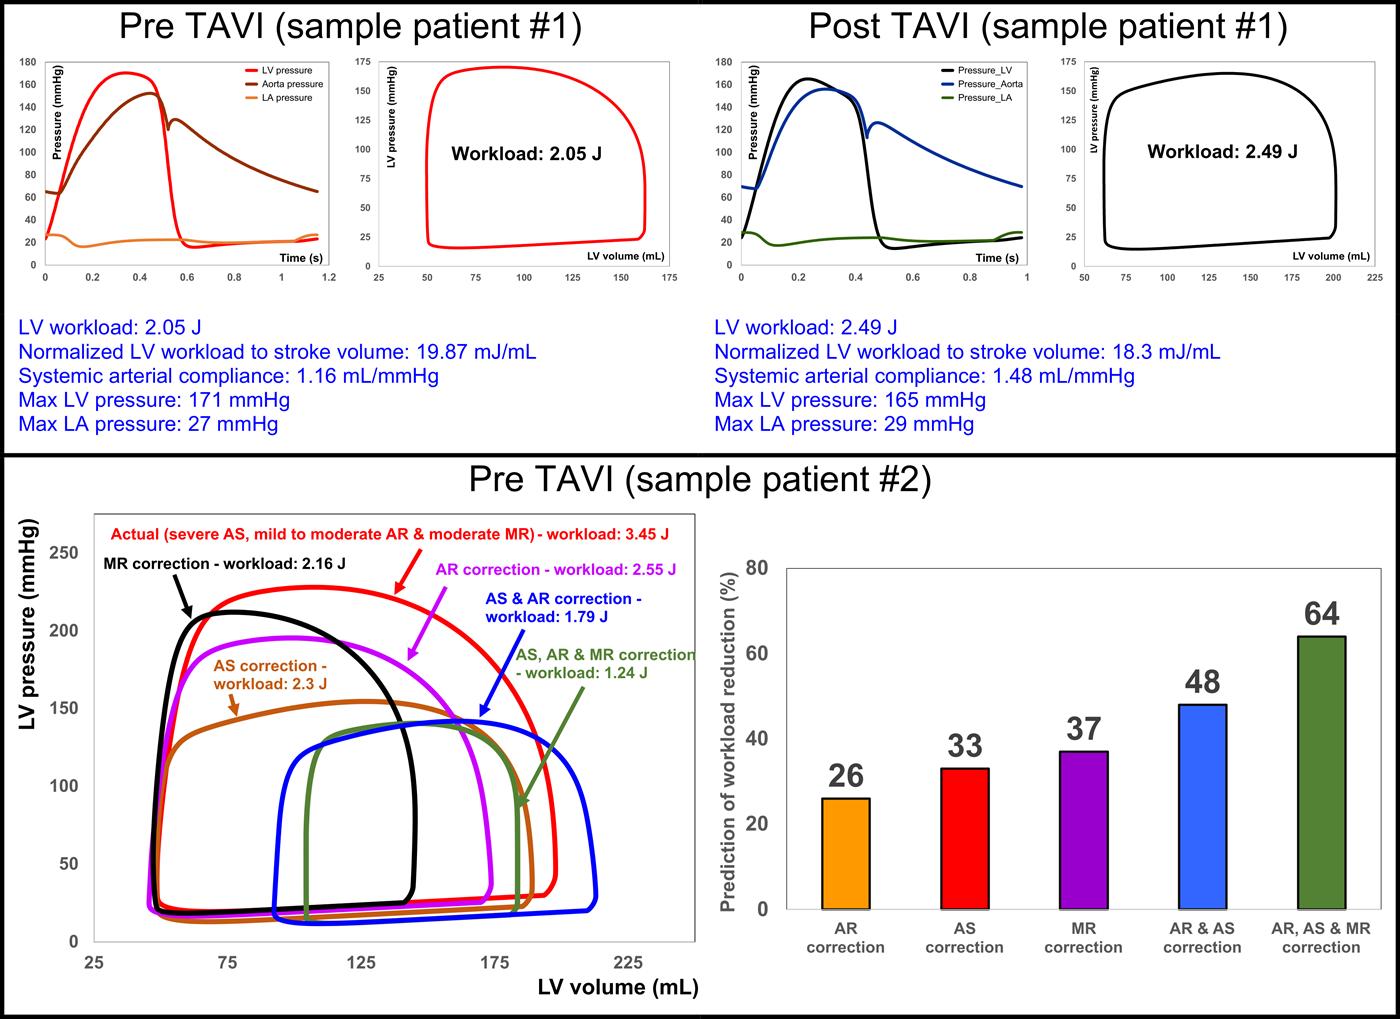
Ventricular pressure-volume loop (PV loop) and other heart function metrics can elucidate etiology of failure of TAVR and interventions
Diagnostic, monitoring, and predictive tool for subjects with complex valvular, vascular and ventricular diseases
and their interventions
LV workload: 1.8J
Normalized LV workload (Workload/SV): 21.7 mJ/mL
Systemic Arterial Compliance: 1.87 mL/mmHg
Max LV pressure: 224.4 mmHg
Max Aortic pressure: 125.5 mmHg
End diastolic pressure (EDP): 12.2 mmHg
End diastolic volume (EDV): 125.6 mL
End systolic pressure (ESP): 202.8 mmHg
End systolic volume (ESV): 44.5 mL
Diagnostic, monitoring, and predictive tool for patients with obstructive cardiomyopathy
Example quantification in one patient with obstructive cardiomyopathy
- Obstructive cardiomyopathy (BSA: 1.88 m2)
- Cardiovascular comorbidities: High BP; Dyslipemia, Gastritis
- No aortic regurgitation; Moderate mitral regurgitation
- Aortic valve effective orifice area: 0.83 cm2
- Blood pressure: 145/76 mmHg
- CW aortic- peak velocity with valsalva: 5.5 m/s; Peak gradient: 121 mmHg

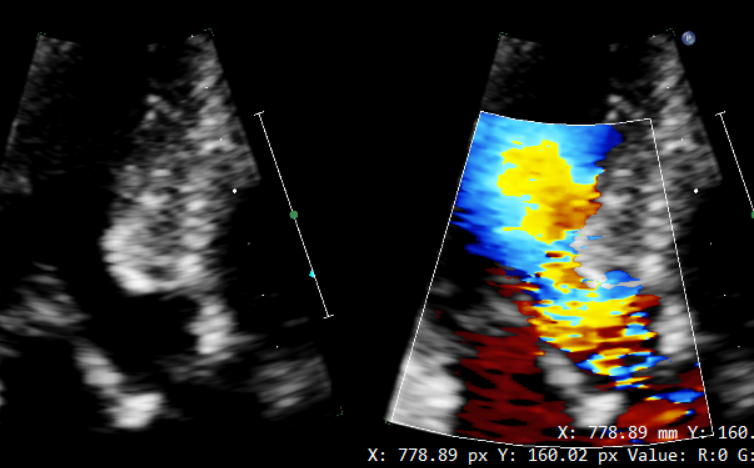
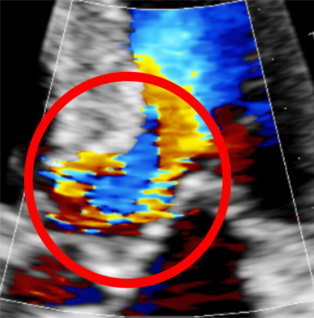
Flow obstruction and turbulent flow due to the left ventricle hypertrophy
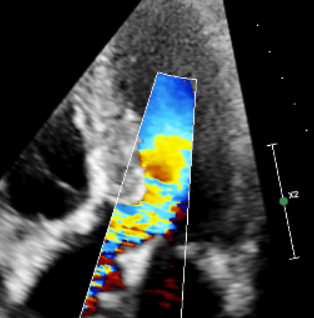
Severe obstructive cardiomyopathy
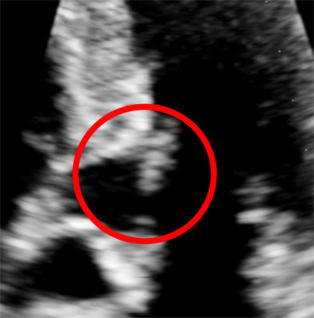
Mitral valve anterior leaflet is in contact with the left ventricle wall during diastole
Severe obstructive cardiomyopathy
Mitral valve anterior leaflet is in contact with the left ventricle wall during diastole
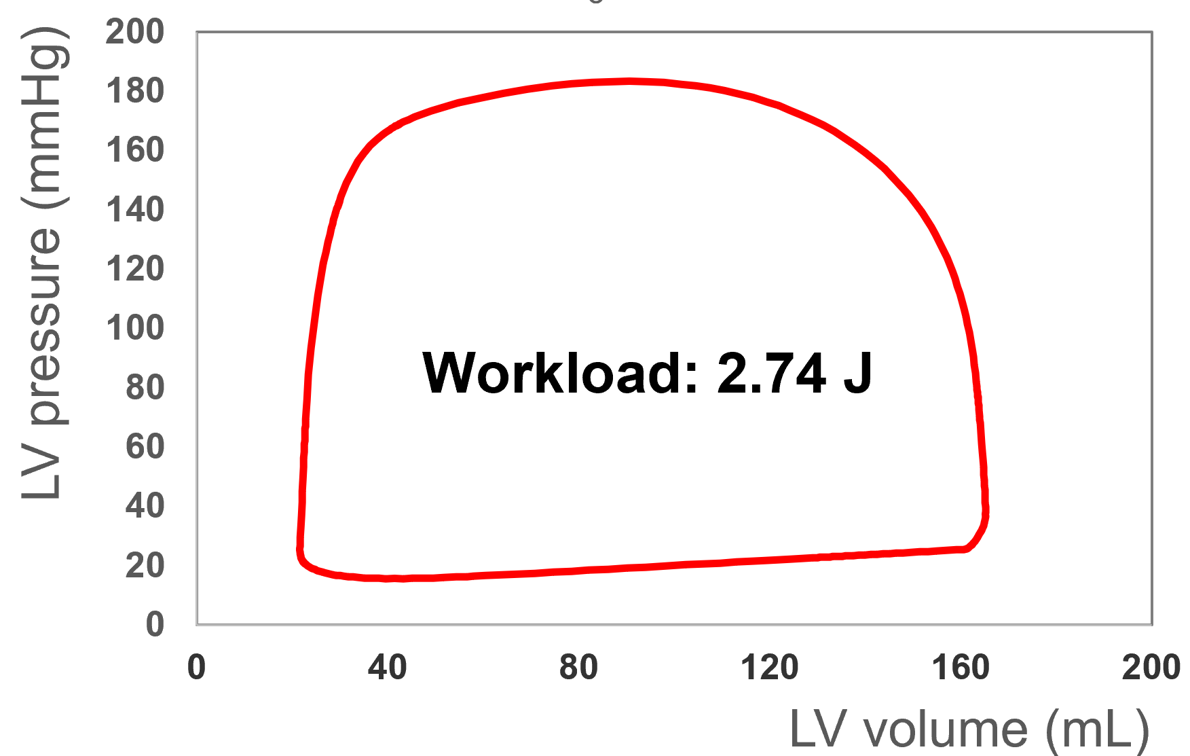
LV workload: 2.74 J
Normalized LV workload (to forward stroke volume) : 27.1 mJ/mL
End diastolic pressure (EDP): 33.5 mmHg
End diastole volume (EDV): 164.5 mL
End systole pressure (ESP): 165 mmHg
End systole volume (ESV): 21.7 mL
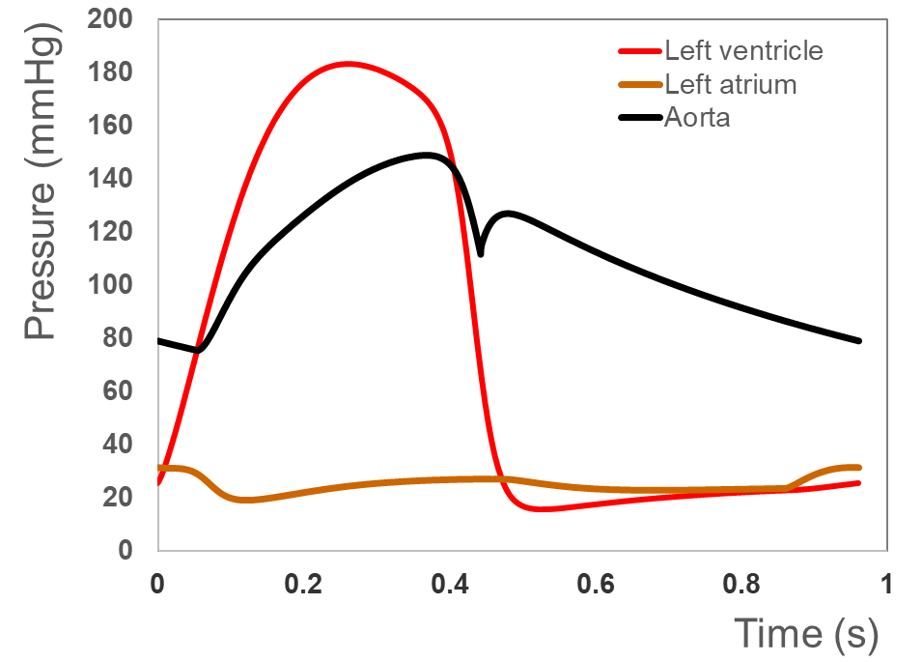
SAC : 0.41 mL/mmHg
Max LV pressure: 183.5 mmHg
Max LA pressure: 31.4 mmHg
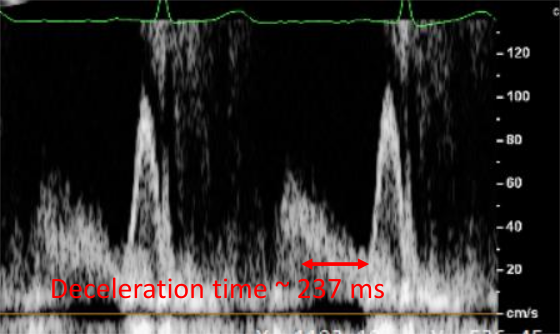
Diastole filling pattern
Peak E wave velocity ~ 70 cm/s
Peak A wave velocity ~ 105 cm/s
E/A ratio ~ 0.66 (normal range : 0.75 – 1.5)
Deceleration time ~ 237 ms (normal range 160 – 260 ms)
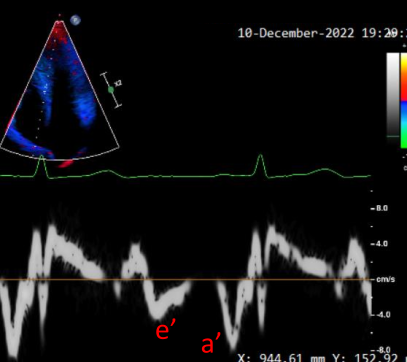
Peak e’ wave velocity ~ 3 cm/s
Peak a’ wave velocity ~ 8 cm/s
E/e’ ratio ~ 23.3 (normal range < 15) (Estimation of LVEDP)